Happy Social Media Day!
Twitter has quickly become my favorite social media platform. While I’ve been using it with increasing frequency over the last nine months, I’ve only just now become interested in its Analytics feature. (As in literally a week ago when I realized you could export the data into Excel.) Twitter does a great job of using visuals and providing snippets of helpful information to users in their online platform, but being able to look at the data in Excel allows for more flexibility. In honor of Social Media Day, I thought I’d provide an easy step-by-step guide on how you can utilize Excel to understand your own Twitter analytics!
Pulling your data
Getting to your analytics and exporting the data into Excel is easy. Simply log into your Twitter account, click on the icon of your profile picture in the top right corner, and select “Analytics.” (If you’re already logged in, can also just go here.)
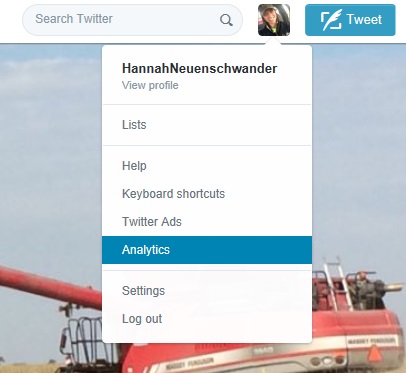
Profile icon –> Analytics
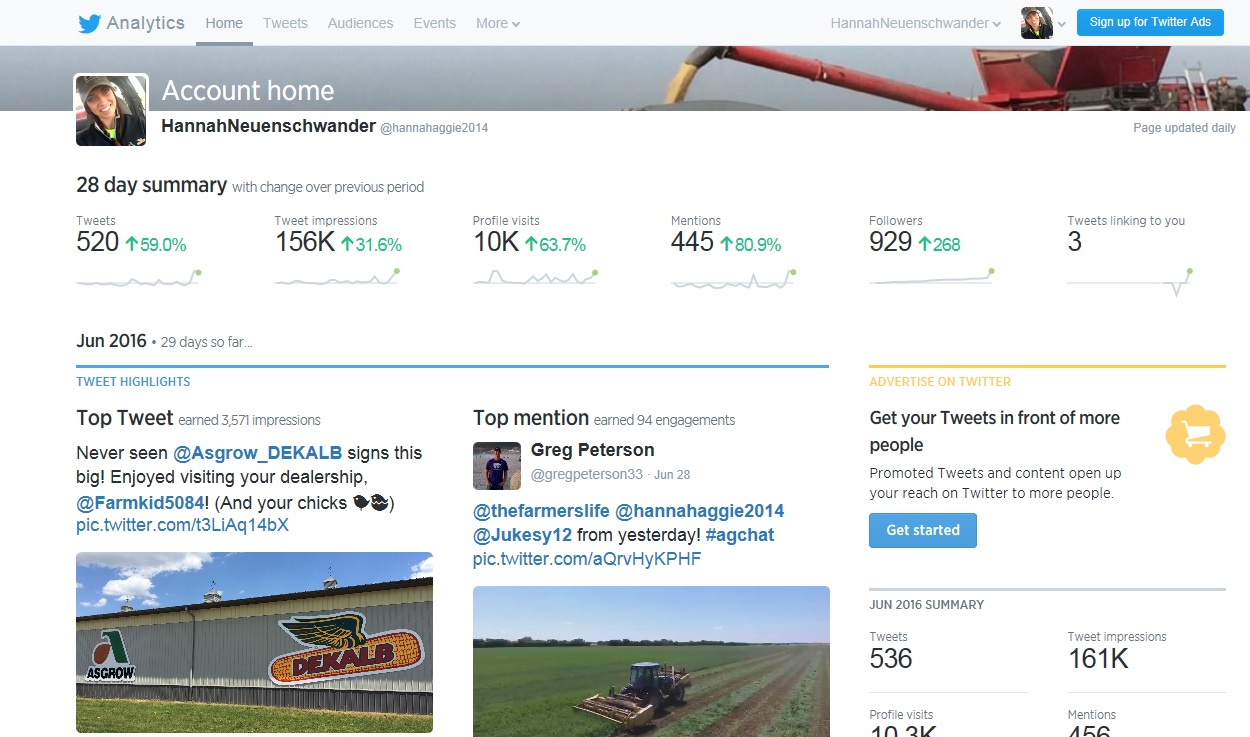
This will bring you to the main analytics page where you can see all kinds of great stuff! There are already many blogs and articles out there describing how you can look at the data from here, so I’ll just skip straight to exporting.

Your Analytics home page
From the Analytics home page, click “Tweets” at the top of the screen. Once you’re no longer distracted by all this other neat data, select a date range and click “Export.”
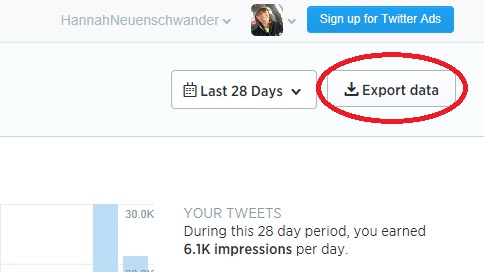
Select date range and click “Export”
Note: You can only export one month at a time, so you may have to repeat this step with different date ranges until you’ve gone as far back as you’d like. I pulled mine from January 1, 2015 to present and simply copy and pasted each export into one big sheet!
Twitter analytics in Excel
Alright, the gig is up. Please understand I’m far from an Excel super-user. This post is just as much for my own benefit as it is for anyone who finds this helpful. Six months from now when I decide to pull all this data again, I’d like to remember how I did it the first time.
So here’s what your data will look like when you first open it in Excel:
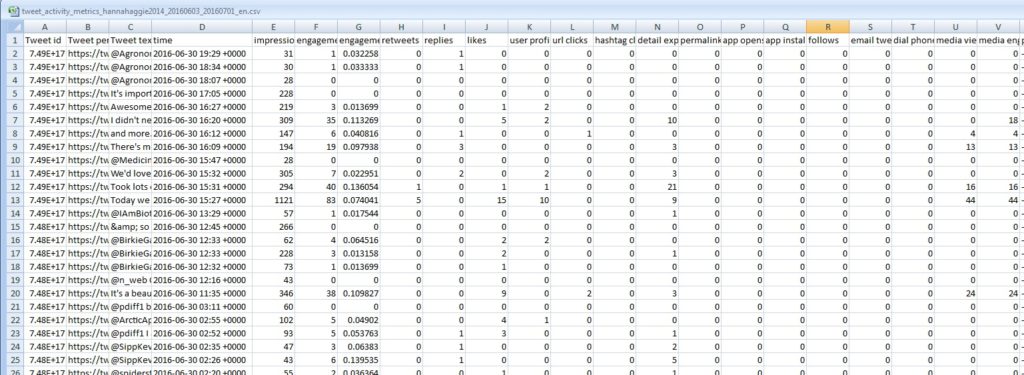
Original Excel data
Your first reaction will be to filter the different columns and figure out which of your tweets got the most impressions, had the best engagements, and got the most likes and retweets. Go ahead, I’ll wait… Now that you’ve got that out of your system, take a look at that totally useless “time” column. For me, one of the main reasons I wanted to look at this data in Excel was to figure out what the optimal times of the day and days of the week were for getting impressions and engagements. With the date/time in its current format, it’s pretty difficult to create pivot tables or graphs to start seeing those trends. So, let’s clean it up.
It will take a variety of new columns and formulas to do that. The first thing I did was separate the date from the time. Insert a new column with the following formula:
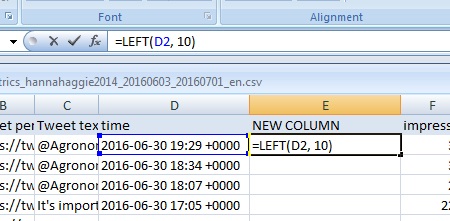
New column –> =LEFT(time cell, 10)
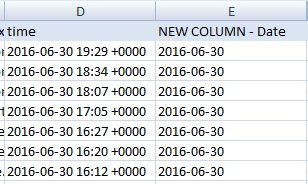
New column with just the date
This pulls the first 10 characters from the left of the “time” cells. Getting the time by itself will take two steps. First, create another new column and use a similar formula to pull the first 11 characters from the right of the cell. Second, create another new column and use the first formula to this time pull the first 5 characters from the left:
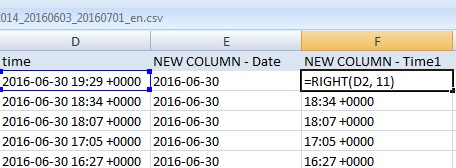
Pulling first 11 characters from the right
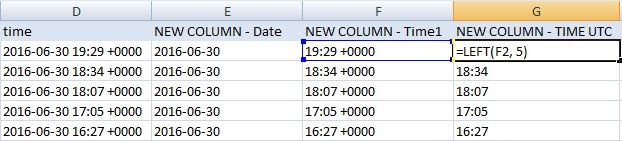
Pulling first 5 characters from the left
Wah-La!
Now you can hide your extra columns and wah-la! I don’t mean to toot my own horn, but being a very basic Excel user, I was pretty proud of myself for doing all of this! Toot-toot! However, thanks to knowing what times I tweet during #agchat on Tuesday nights between 7pm and 9pm central time (CT), I realized these time-stamps were in UTC (universal time coordinated.) This means not only are these times not in the right time zone, but after 7pm my time, they weren’t even on the right day! Luckily, there’s a formula for that (sorta.)
The following steps will be for converting all of this into central time so you might have to make your own adjustments to the formulas for your time zone!
Converting time zones
Note: It was at this time that I decided I didn’t need to be specific down to the minute of when I tweeted, so I used our formula from above again to only see the hour.
Before correcting the dates, we need to change the time into the correct time zone. A quick Google search informed me that UTC was 5 hours ahead of my CT. It’s not as easy as subtracting 5 from the hour because doing that for the times between 00 and 04 would create a negative number! Plus, apparently Excel doesn’t like reading numbers in that format anyways…
To navigate around that, I used the control + F function to replace times falling between 00-05 to single digits. You must do these individually and don’t forget to highlight the column or else you’ll replace those digits in the whole workbook. Excel doesn’t like to do this if the cell contains a formula like ours does, so you’ll need to create yet another column to copy and paste only the values into.
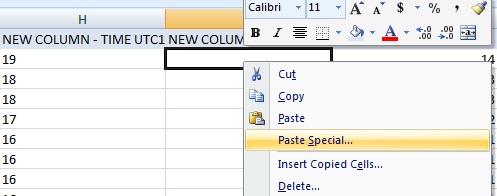
Create a new column –> Copy your hours –> Paste special
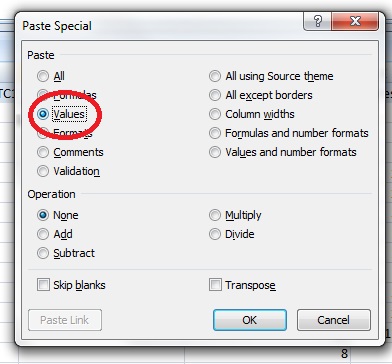
Click Values
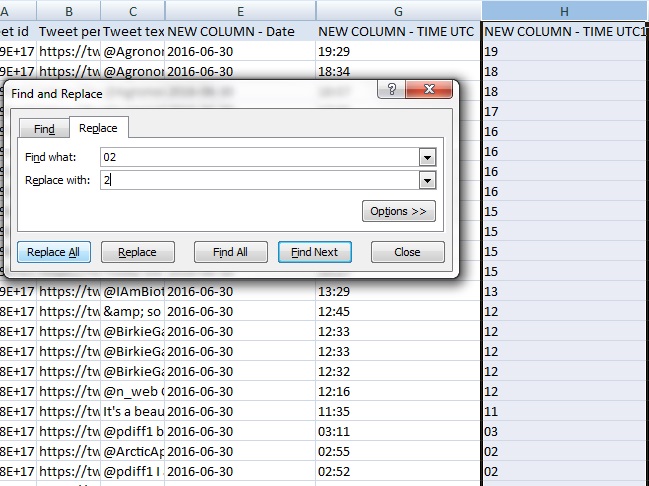
Ctrl + F to replace each hour individually from 00 – 05 with single digits
It’s time for some lovely IF statements! Next, I used the following formula to add 19 to any hours <5 and subtract 5 from everything else:
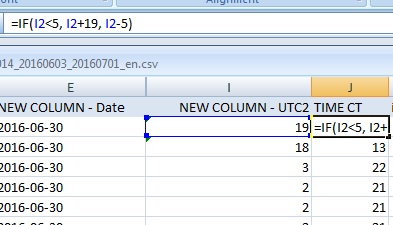
In a new column, =IF(UTC hour<5, UTC hour+19, UTC hour-5)
Now all of the hours are in central military time. To take it a step further, we really need to adjust the dates to account for the UTC time zone Twitter originally recorded them in. If UTC is 5 hours ahead of CT, my data was recorded as being on a new day at 17:00 central. Lucky for us, Excel treats dates just like numbers so it’s easy to fix this with another IF statement. I want any CT hours 17 or later to go back a day to account for the UTC time it was originally recorded as. If it’s less than that, it can stay the same:
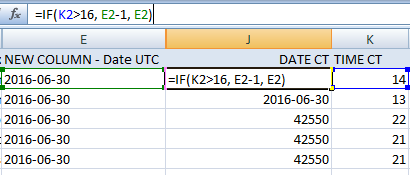
Any CT hour later than 17 needs to be set back a day
You’ll notice the ones that need to set back a day are recorded as numbers. Simply reformat the column to reflect “Short Date” instead of “General.”
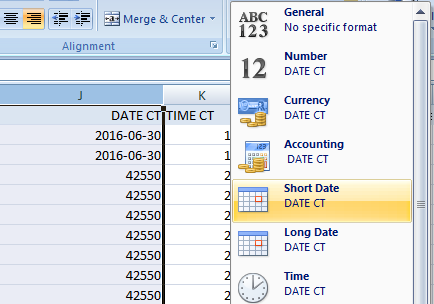
Change cell format to “Short Date”
ETA: Lastly, you can create a new column and use the formula below and change the YYYY-MM-DD date to reflect the day of the week:
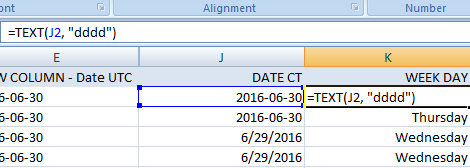
To show week day: new column —> =TEXT(date cell, “dddd”)
Finally we have the dates and times in a format that is useful to us! You can clean up the sheet by hiding any of our intermediate columns that we had to create to transform the original data. (P.S. if you know of an easier way to do all of this, please don’t tell me… Just kidding, please comment below!) From here you can create pivot tables and graphs that will paint you a picture of how your tweets perform at different times of the day and on different days of the week.
Do you use apps or third party software to get a deeper look at your Twitter analytics? Let me know below!
November 13, 2020 at 6:55 PM
Four years after original post, I figured out the time zone conversion!
Even with four years of other blogs, this was still the most helpful one I found for thinking about how to manage the not exactly user friendly Twitter analytics exports.
For the time zone conversion, I really wanted to eliminate the manual steps and hopefully solved it. If you have four columns, A is the formatted date extracted from what they give you and B is the formatted time extracted from what they give you.
Column C is the Corrected Date and has this formula (I’m correcting for 7 for pacific time, use 5 for central time) =IF(B2>(7/24),A2,(A2-1)). This tells it to look at the time column, and if the time column is greater than 7/24 then it is the correct date, if it is less than 7/24 then subtract 1 from the date (like when the export shows a tweet at 1am Tuesday, that tweet actually happened Monday night).
Column D is the Corrected Time and has this formula =IF(B2>(7/24),(B2-(7/24)), (1-(7/24)+B2)). This tells it to look at the time column, and if it is greater than 7/24 just subtract 7/24 from it to get the true value. If it is less than 7/24 then the correct value is 1 (24 hours) – the time shift + whatever value is there